Spa visits carry measurable carbon footprints that vary with energy use and renewables
Impact assessment
Core model and total facility emissions
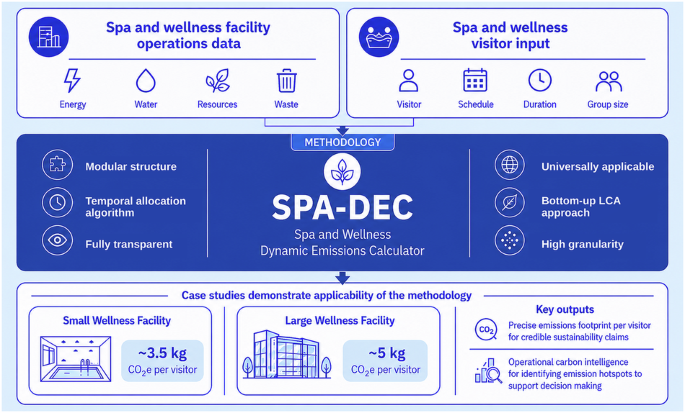
The main output of this study is a generic, universal SPA-DEC framework that can be applied across diverse facilities of certain characteristics, which merit their distinct presence in the governing (high-level) equations as follows, to calculate the time-resolved greenhouse gas (GHG) emissions through the SPA-DEC framework, detailed in the Methodology section.
At its core, the SPA-DEC model follows a fundamental emissions calculation formula:
$${{\rm{E}}}=A\times {EF}$$
(1)
where A is activity data, such as energy consumption, and \({EF}\) is the emissions factor in kg CO2e per unit of activity data.
The total carbon footprint of a visitor’s spa visit is calculated as:
$${{{{\rm{CO}}}}}_{2}{{{\rm{e per visitor}}}}={\sum}_{h\in {H}_{{visit}}}\frac{{E}_{h}}{{N}_{h}}+\frac{{E}_{d}^{{closed}}}{{N}_{d}}\,+{\sum}_{{{{\boldsymbol{V}}}}}\frac{{x}_{V}}{{N}_{A}}+{\sum}_{{{{\boldsymbol{B}}}}}\frac{{x}_{B}}{{N}_{A}}$$
(2)
Where \({E}_{h}\) is the total metered emissions from all sources \(s\) during hour \(h\), obtained using:
$${{{\rm{E}}}}_{h}={\sum}_{s}{A}_{s,h}\times {{EF}}_{s}$$
(3)
\({H}_{{visit}}\) is the set of open hours that overlap with the visitor’s stay in the resort \(\left[{t}_{0},{t}_{1}\right]\) on day \(d\), and \({N}_{h}\) is the number of visitors present during hour \(h\). The first term attributes open-hour emissions to the visitor in proportion to the occupancy of each hour.
\({E}_{d}^{{closed}}\) are the total emissions accrued during closed hours on day \(d\), allocated equally across \({N}_{d}\), the unique visitors recorded on that day.
\({x}_{V},\,{x}_{B}\) represent non-metered visitor and business operation emissions for each category \(V,B\). These emissions are measured annually and divided by the total number of annual visitors, \({N}_{A}\), to give the per-visitor impact.
Individual terms in Eq. (2) are comprehensively addressed incorporating full life cycle stages or embedded emissions for each foreground inventory and the nature of the time-series foreground inventory data is also discussed in the Methodology section.
The SPA-DEC framework was applied to two contrasting real-world facilities for the calendar year 2024: a university swimming-pool and wellness zone based in the UK (Small Wellness Facility) and a large wellness resort based in Romania (Large Wellness Facility).
The total annual global warming potential or GHG emission impacts (in CO2e) (referred as emission in the paper) for the Large Wellness Facility were ~7437 t CO2e across the reporting year, of which 4447 t CO2e arose from metered energy and water consumption and 2990 t CO2e from non-metered categories including fugitive refrigerant losses, inbound logistics, staff commuting, and spend-based procurement estimates. The Small Wellness Facility reported a total emission of 242 t CO2e, of which 225 t CO2e derived from metered electricity and natural-gas consumption and only 17 t CO2e from non-metered sources. The approximately thirty-fold difference in absolute emissions reflects the difference in facility scale: the Large Wellness Facility served 1,620,619 visitors in 2024, whereas the Small Wellness Facility hosted 74,973 visitors. As the size and capacity can vary widely, a functional unit per visitor is well justified to calculate via this developed robust dynamic emission calculator.
Scope breakdown
Table 1 summarises how the activity data used in the two case studies map onto Scopes 1–3 and how each parameter contributes to the emission totals reported in this section. Metered operational flows (purchased electricity, on-site gas, on-site geothermal, on-site photovoltaic and water) provide time-resolved activity data and therefore drive the hourly and seasonal variability explored in the subsequent figures. In contrast, several Scope 3 emissions are typically available only as annual measures derived from procurement records, contractor reporting or financial accounts (for example, waste, consumables, inbound logistics and additional goods and services).
Figure 1 presents the GHG Protocol scope classification for each facility. The two sites exhibit markedly different scope profiles, reflecting their divergent energy mixes and operational structures.

Annual greenhouse-gas emissions for 2024 apportioned to Scopes 1, 2 and 3 as a percentage of each facility’s total; central labels give the absolute annual total. a Small Wellness Facility (242 t CO2e). b Large Wellness Facility (7,437 t CO2e). Scope 1 (orange) covers direct combustion, fugitive refrigerants and company transport; Scope 2 (blue) is purchased electricity; Scope 3 (green) covers value-chain categories including water, waste, procurement, logistics and staff travel, together with the embodied emissions of on-site photovoltaic and geothermal infrastructure.
At the Small Wellness Facility, Scope 1 accounts for 38.0% of the total emissions, driven predominantly by on-site natural-gas combustion for pool-zone heating, with smaller contributions from company transport and fugitive R410A losses from the pool air-handling unit. Scope 2 contributes 53.8%, while Scope 3 categories collectively represent 8.2%. The resulting profile shows Scope 1 and Scope 2 together accounting for over 90% of emissions.
The Large Wellness Facility presents a more balanced distribution: Scope 1 accounts for 33.4%, reflecting the material contributions of on-site natural-gas combustion, fugitive refrigerant losses, and company transport. Scope 2 contributes 29.7%, while Scope 3 categories account for 36.9%, including the life cycle embodied emissions from the geothermal heat and photovoltaic infrastructure. On-site photovoltaic and geothermal energy incurs no point of generation emissions. The embodied, upstream manufacturing and installation emissions of this infrastructure are accounted for separately as Scope 3, using life cycle emission factors from Ecoinvent. Reporting these two components separately keeps the inventory consistent with the GHG Protocol scope definitions while retaining the life cycle completeness of an LCA perspective; the two are complementary rather than alternative treatments of the same emissions39. The electricity used to operate the geothermal heat-pump system at the Large Wellness Facility is metered within the facility’s purchased electricity and accounted under Scope 2 via the time-resolved grid factor, distinct from the geothermal life cycle emission factor; operational and embodied emissions are therefore not double-counted. The relatively even split underscores the importance of full scope accounting for diversified thermal wellness facilities where supply-chain, life cycle infrastructure, and operational emissions are all material.
Metered consumption emissions
Figure 2 presents the hourly per-visitor metered consumption emissions at the Large Wellness Facility during 2024, disaggregated by electricity, gas, geothermal, photovoltaic (PV), and water. The plot illustrates the pronounced day-to-day and seasonal variability in emissions, with the largest fluctuations driven by grid electricity and gas. Emission intensities rise sharply in the winter period and exhibit intermittent spikes, consistent with periods when demand is higher and a larger share of energy is met by grid and gas back-up rather than low-carbon supply.

Per-visit emissions (kg CO2e) from metered operational sources, resolved at hourly intervals and disaggregated by source: geothermal (orange), gas (rust), grid electricity (blue), water (green) and photovoltaic (yellow). Grid electricity and gas dominate and drive the pronounced winter peaks and day-to-day variability, while geothermal, water and photovoltaic contributions remain comparatively low and stable; photovoltaic and geothermal values represent embodied upstream emissions of the energy infrastructure rather than emissions at the point of generation.
The seasonal variation in grid electricity emissions is driven not only by changes in facility demand but by the composition of the national electricity grid itself, which varies materially across the year. Using hourly grid generation data sourced from the national transmission system operator (Supplementary Fig. S2 shows the monthly grid consumption, split by source), the purchased electricity mix was resolved at hourly resolution for each month of 2024. The data show that hydroelectric generation dominates supply during spring and summer months, suppressing the grid emission factor during the period of lowest facility demand. Conversely, coal and gas-fired generation represent a greater share of supply during winter months, coinciding with peak facility heating and electrical loads. Purchased electricity is characterised with the highest resolution grid factor available. By linking hourly grid composition data to hourly facility electricity consumption, SPA-DEC can apply a temporally resolved emission factor rather than a flat annual average. This is central to the framework’s advantage over static approaches. A single annual grid emission factor could systematically understate emissions intensity in winter and overstate it in summer, obscuring the true seasonal amplitude of per-visitor footprints.
By contrast, geothermal and water-related emissions remain relatively stable year-round, reflecting more consistent baseload provision and less sensitivity to short-term operating conditions. PV contributions appear as a small but increasingly visible contribution following commissioning in early 2024 and coincide with periods of reduced reliance on grid electricity. Emissions arising from PV and geothermal are embodied upstream manufacturing emissions of the energy infrastructure, rather than direct GHG releases. Figure 2 illustrates the central advantage of SPA-DEC for operational analysis. By combining high-frequency data handling with per-visitor normalisation, the method captures variability at the temporal scales that matter for both facility management and visitor-level attribution.
Figure 3 shows the closed-hour per-visitor emissions at the Large Wellness Facility for 2024, disaggregated by metered source. In contrast to the open-hour profile, these values represent overhead emissions accrued when the facility is not receiving visitors and are therefore expressed on a per-visitor basis rather than a per visitor-hour basis. As a result, the magnitude of the closed-hour signal is higher: the same pool of out-of-hours emissions is distributed across the visitors who attend, whereas open-hour emissions scale with the duration of each individual stay.

Per-visit emissions (kg CO2e) accrued during closed hours, disaggregated by metered source: geothermal (orange), gas (rust), photovoltaic (yellow), grid electricity (blue) and water (green). Closed-hour emissions represent the facility’s maintenance baseline – overnight thermal storage, recirculation and preparatory loads – and are allocated equally across the unique visitors recorded on each calendar day and are therefore expressed per visitor rather than per visitor-hour. Gas and grid electricity dominate, with the highest overheads in winter; water and photovoltaic contributions remain small.
The temporal pattern remains dominated by gas and grid electricity, with markedly higher overhead intensities during winter months when baseline thermal and electrical loads are greatest. Geothermal and water-related contributions are comparatively stable, while PV remains small. This distinction between open-hour and closed-hour components is central to SPA-DEC’s visitor allocation logic: it separates shared facility overheads from time-dependent operational loads, ensuring that visitor footprints reflect both the timing of a visit and the facility’s baseline operating requirements.
Renewable energy scenario modelling
Using SPA-DEC, a comparison can be made between each facility’s observed 2024 energy configuration, which integrates on-site geothermal supply and photovoltaic generation, with a counterfactual scenario in which thermal demand is met by on-site gas and electricity demand by the grid. Figure 4 shows that the counterfactual scenarios consistently yield higher daily emissions across the year, with the gap widening during periods of elevated energy demand.

Daily metered source emissions (kg CO2e) across 2024 under the observed 2024 energy configuration (actual, with renewables; blue) and a counterfactual in which on-site renewable supply is replaced by grid electricity and gas (orange); the shaded band marks the avoided emissions between the two. a Small Wellness Facility, where on-site photovoltaic generation avoids 36.8 t CO2e (14.0% of metered emissions). b Large Wellness Facility, where geothermal and photovoltaic supply avoid 2,182.7 t CO2e (32.9%). The avoided gap widens during periods of elevated energy demand.
For the Small Wellness Facility, the counterfactual replaces the 198 MWh of allocated on-site PV generation with grid electricity. Under this scenario, annual metered emissions would rise from 225 to 262 t CO2e, implying that the on-site PV array avoids ~36.8 t CO2e over 2024, a 14.0% reduction in metered source emissions. The timeseries reveals that the avoided-emission gap is widest during the summer months, when PV generation peaks and would otherwise displace the highest volume of grid electricity. During winter, reduced solar irradiance narrows the gap substantially, confirming that the decarbonisation benefit of on-site PV at the Small Wellness Facility is strongly seasonal.
The Large Wellness Facility’s 2024 energy-related emissions amounted to 4447 t CO2e, compared with 6629 t CO2e under the grid and gas scenario. This corresponds to an emission reduction of 2183 t of CO2e, ~32.9%, attributable to geothermal and PV supply. Beyond demonstrating mitigation potential of on-site renewables in facilities, this analysis illustrates how SPA-DEC can be used to evaluate operational decarbonisation options using the same metered consumption data framework that underpins the per-visitor results. The timeseries shows that the avoided-emission gap is persistent year-round owing to the continuous thermal load served by geothermal but widens markedly during the winter season (October–March) when the overall thermal consumption requirement is largest, and thus geothermal extraction volumes peak. This finding confirms that the geothermal and PV systems at the Large Wellness Facility are a substantial decarbonisation asset, with the geothermal component providing a baseload emission reduction that complements the seasonal PV contribution.
Daily footprint overview
The standard visit durations used here – 4.0 h at the Large Wellness Facility and 1.5 h at the Small Wellness Facility – reflect the typical commercial entry period at each site. SPA-DEC is not constrained to these durations; the dynamic allocation framework produces a footprint for any visitor stay length, and the illustrative durations are used here solely to enable consistent cross-month and cross-facility comparison.
Figure 5 decomposes the per-visit footprint by individual emission source for each facility at its standard visit duration, presented as monthly averages to reveal how source-level contributions evolve across the year. The per-visit footprint is partially sensitive to visit duration. The open-hour metered component scales with stay length, while the closed-hour overhead and non-metered components are fixed per visitor regardless of duration. As a result, the total per-visit footprint scales sub-linearly with visit duration.

Mean per-visit emissions (kg CO2e) for each calendar month of 2024, stacked by source, with the monthly total printed above each bar. a Large Wellness Facility for a standard 4.0-h visit. b Small Wellness Facility for a standard 1.5-h visit. Stack segments follow the order of the key; grid electricity and natural gas dominate in both facilities, with the remaining, mainly Scope 3, categories forming a thin and largely constant per-visit layer.
At the Large Wellness Facility, the monthly average per-visit footprint for a standard 4.0-h visit ranges from 3.83 kg CO2e in July and August to 7.13 kg CO2e in December, a seasonal amplitude of 3.30 kg CO2e. For context, Eurostat estimates the GHG footprint of goods and services consumed in the EU amounted to 29.31 kg CO2e per capita each day in 202240. The largest contributors to the overall footprint are the facility’s grid electricity consumption used to back up the PV energy production, and on-site natural gas consumption used to supplement the geothermal thermal energy production. By contrast, other categories like water treatment, consumable goods, and waste management contribute comparatively small amounts per visitor. Monthly variation in the per-visit footprint reflects the interplay between seasonal energy demand and visitor throughput. October shows an elevated footprint relative to summer months, driven by declining PV contribution and lower visitor numbers, the latter increasing the overhead emissions allocated to each visit. December records the highest per-visit footprint, consistent with peak natural gas demand in winter months when geothermal backup requirements are greatest and PV generation is negligible (Supplementary Fig. S1).
At the Small Wellness Facility, a standard 1.5-h visit produces a monthly average emission ranging from 2.61 kg CO2e in August to 4.26 kg CO2e in December, a seasonal amplitude of 1.65 kg CO2e. The two metered energy sources, grid electricity and natural gas, dominate the per-visit footprint in every month, with non-metered categories contributing a thin, constant baseline layer.
Across both facilities, the monthly decomposition highlights two key features of the SPA-DEC model: first, the strong seasonal modulation of metered per-visit emissions, driven by the interplay of energy demand and occupancy; and second, the constant per-visitor non-metered contribution, which provides a full understanding of how non-metered, mainly Scope 3 emissions are allocated per visitor.
Temporal trends
SPA-DEC also reveals clear temporal patterns in visitor emission footprints. Figure 6 displays the distribution of per-visitor emissions for a four-hour visit at the Large Wellness Facility, segmented by weekday and month. Across the week, per-visit emissions are highest midweek and lowest on Saturdays, and their dispersion tracks their level: quieter weekdays show not only a higher median but a broader interquartile range and pronounced right skew, whereas Saturdays exhibit both the lowest median and the narrowest spread. Both patterns are consistent with an inverse relationship with visitor volume. When attendance is lower, a larger share of baseline and overhead emissions is allocated to each visitor, increasing the per-visit footprint. This dynamic is compounded by the facility’s energy demand profile. During opening hours, electricity and gas consumption rises sharply relative to the overnight baseline, reflecting the operational load of heating, filtration, lighting, and visitor-facing services. As visitor numbers fall on quieter weekdays, this elevated operational load is distributed across fewer visits, amplifying the per-visitor footprint effect.

Per-visit emissions (kg CO2e) for a standard 4.0-h visit in 2024, summarising the distribution of daily values within each group. a By day of week. b By calendar month. Boxes show the median (centre line) and interquartile range; whiskers extend to 1.5× the interquartile range and points beyond them are plotted individually. Per-visit emissions are lowest at weekends and in summer, when occupancy and the renewable share are highest, and highest on quieter weekdays and in winter.
The overnight period represents a structurally distinct emissions source. During closed hours, the facility maintains a continuous thermal baseline: excess heat is stored in boilers, and water is kept at temperature in preparation for the following day’s operations. This maintenance load is not attributable to any individual visit and is instead allocated proportionally across all visitors within the corresponding period. Bringing this closed-hour baseline into the emissions accounting is a methodological distinction of SPA-DEC. Rather than treating overnight consumption as negligible or excluding it from visitor-level calculations, the framework allocates it transparently, ensuring that the reported per-visit footprint reflects the full operational cost of delivering a visit, including the preparatory energy burden that precedes it.
Seasonality is also visible. Monthly medians decline through spring and reach their lowest levels in summer, before increasing again toward winter. This pattern aligns with the metered-consumption results, reflecting both weather-driven demand and the changing contribution of on-site renewables: during summer months, geothermal and PV systems meet a greater share of the facility’s energy needs and reduce reliance on gas and grid electricity, lowering the emissions intensity of a visit. These temporal trends indicate that the visitor footprint is shaped not only by what a facility consumes, but also by when a visit occurs and how fixed operational requirements are distributed across fluctuating attendance.
Sensitivity and uncertainty analysis
A 50,000-draw Monte Carlo analysis was performed independently for each facility to propagate parametric uncertainty through the SPA-DEC allocation model. All uncertain inputs were represented as standard unit-mean lognormal multipliers, with coefficients of variation (CVs) calibrated to reflect data quality: 5% for hourly metered activity data, 5–20% for secondary emission factors, 20–50% for annually estimated non-metered categories and fugitive-leakage terms. These coefficients of variation were assigned by structured expert judgement based on data provenance, following the principle that uncertainty scales inversely with the directness of measurement: directly logged hourly quantities (electricity, gas, water, and the occupancy denominator) are well constrained and receive low CVs; secondary emission factors drawn from literature or conversion tables are materially less precise; and annually estimated or spend-based categories are the least constrained and receive the highest CVs, reflecting their reliance on sparse records or input-output modelling. Per-input values and rationales are reported in Supplementary Table S1. The resulting per-visit distributions and global sensitivity rankings are presented in Fig. 7.

Parametric uncertainty propagated through the SPA-DEC allocation model using 50,000 draws per facility, with all uncertain inputs represented as unit-mean lognormal multipliers. Monte Carlo distributions of per-visit emissions (kg CO2e) for the Small Wellness Facility (a) and the Large Wellness Facility (c); the dashed line marks the deterministic baseline and the dotted lines the 95% uncertainty interval. Spearman rank correlation (ρ) between each input and the per-visit output for the Small (b) and Large (d) facilities, ordered by absolute correlation; positive correlations are red, negative correlations blue.
For the Small Wellness Facility, the Monte Carlo analysis yields a 95% uncertainty interval (UI) of 3.01–4.15 kg CO2e around the deterministic baseline of 3.53 kg CO2e per 1.5-h visit (Monte Carlo mean 3.54 kg CO2e, SD = 0.29 kg CO2e, CV = 8.2%). The coefficient of variation (CV), also known as relative standard deviation (RSD), is a statistical measure that quantifies the degree of variability in a dataset relative to its mean. It represents the standard deviation (SD) as a percentage of the mean. The distribution is moderately right-skewed, characteristic of lognormally propagated uncertainty. The relatively narrow interval reflects the high data quality of the Small Wellness Facility’s hourly metered electricity and gas consumption, which together constrain the two dominant emission sources.
For the Large Wellness Facility, the 95% UI spans 4.23–5.96 kg CO2e around the baseline of 4.98 kg CO2e per 4.0-h visit (Monte Carlo mean 4.99 kg CO2e, SD = 0.44 kg CO2e, CV = 8.8%). The two facilities exhibit similar coefficients of variation (Small Wellness Facility 8.2%, Large Wellness Facility 8.8%), despite their difference in size, complexities and occupancies. At the Small Wellness Facility, the narrower CV reflects the high data quality of the two dominant metered sources (electricity and gas), which together constrain the output tightly. At the Large Wellness Facility, the diversification across many independent inputs provides partial variance cancellation, offsetting the higher individual CVs assigned to spend-based and fugitive categories.
The Spearman rank-correlation tornado diagrams in Fig. 7 reveal qualitatively different sensitivity structures within each facility. It measures how well the relationship between two variables holds by a monotonic function (i.e., whether they increase together even if not at a constant rate). At the Small Wellness Facility, the grid electricity emission factor remains the dominant driver of output uncertainty (Spearman ρ = 0.644), followed by the metered allocation denominator (ρ = –0.555) and electricity activity (ρ = 0.317). The allocation denominator’s strong negative correlation reflects the inverse relationship between occupancy estimates and per-visitor emissions: higher assumed occupancy distributes the same total emissions across more visitors, reducing the individual footprint. Notably, the inclusion of natural-gas data has moderated the dominance of the grid emission factor relative to an electricity-only model, while elevating the importance of the allocation denominator, which now governs the per-visitor distribution of a larger aggregate emission total.
At the Large Wellness Facility, the sensitivity landscape is more distributed. The additional-goods-and-services total (ρ = 0.559) and fugitive-emissions total (ρ = 0.464) emerge as the two most influential inputs, reflecting the high uncertainty CVs (40% and 50% respectively) assigned to these spend-based and leakage-based categories. The metered allocation denominator ranks third (ρ = −0.356), while the grid emission factor, natural-gas activity, and inbound-logistics total all contribute moderate sensitivities. This diffuse sensitivity profile is consistent with the Large Wellness Facility’s more balanced emission portfolio: reducing uncertainty in any single input will yield only incremental improvements in total-footprint precision, and meaningful uncertainty reduction will require simultaneous improvement across multiple data streams.
These results highlight a broader methodological insight: for facilities where metered energy dominates the GHG emission contributions, investment in higher-resolution grid emission factors (e.g., hourly rather than flat annual) and accurate occupancy denominators delivers the greatest return on uncertainty reduction. For diversified wellness facilities with large non-metered categories, improving the quality of spend-based and fugitive emission estimates is the priority, as these poorly constrained inputs collectively drive the majority of output variance.
Interpretation
Case studies as contrasting applications
The two case studies provide complementary scenarios of operational greenhouse-gas drivers across contrasting spa and wellness contexts. The Large Wellness Facility case study provides a high-resolution characterisation of operational GHG drivers in a large, complex spa and wellness centre. The Small Wellness Facility represents a simpler operational profile: two metered energy sources, a single zone, and a visitor base an order of magnitude smaller. Together, they demonstrate that SPA-DEC’s allocation logic is transferable across facility types without modification to the core framework.
The Large Wellness Facility is a commercial thermal resort, whereas the Small Wellness Facility is a university sports park wellness zone operating under a fundamentally different business model, visitor profile, and service scope. Because the per-visit functional unit is not normalised for the level of service delivered within a visit, the resulting footprints reflect both operational efficiency and the breadth of amenities provided and should not be interpreted as a direct ranking of relative sustainability. Robust cross-facility benchmarking with SPA-DEC requires aligned system boundaries and comparable service definitions; the most directly comparable analyses demonstrated here are within-facility across time and season, and against the renewable-energy counterfactual, where boundaries are held identical.
Both case studies reinforce the broader expectation that spa and wellness facilities are energy-intensive by design, requiring sustained demands for heating, water pumping, and air handling. At both sites, Scope 1 and Scope 2 together account for the dominant share of the total impact, consistent with the operational profile of water-heated, climate-controlled leisure infrastructure. However, the two facilities exhibit markedly different scope distributions, reflecting their divergent energy mixes: the Small Wellness Facility’s simpler profile concentrates over 90% of impacts in Scopes 1 and 2, while the Large Wellness Facility’s geothermal and photovoltaic integration, combined with substantial Scope 3 procurement and logistics, produces a substantially more balanced three-scope distribution.
Atalay and Demir13 reported energy-related per-visitor footprints of ~8 kg CO2e for spa facilities in Turkey and Lithuania13,14. This excludes other operational emission sources. In contrast, the Large Wellness Facility’s mean per-visit footprint of ~5 kg CO2e is lower despite including additional categories like waste and staff commuting. This suggests that renewable integration can offset a large share of the energy burden that typically dominates spa footprints. At the same time, the Large Wellness Facility case study makes clear that non-metered sources are not negligible: fugitive emissions, logistics, and spend-based additional goods and services all contribute materially to the facility footprint: at the Large Wellness Facility, Scope 3 categories collectively account for over 30% of the total emissions. This provides an important caution against calculating environmental impacts solely through metered utilities.
The renewable energy scenario analysis, which compares observed 2024 emissions against a counterfactual grid and gas-only baseline, reveals how the dynamic allocation framework enables this kind of operational evaluation. The 32.9% emissions reduction attributable to geothermal and photovoltaic supply at the Large Wellness Facility is derived from the same metered consumption data that underpins the per-visitor results: because SPA-DEC tracks emissions by hour and by source, it is straightforward to substitute alternative emission factors for each energy stream and recalculate the per-visitor and aggregate outcomes. The counterfactual is not a standalone analysis but a direct output of the framework, demonstrating how the same infrastructure used for visitor-level attribution can also support facility-level decarbonisation planning.
Dynamic emissions accounting
SPA-DEC is dynamic in two senses. First, it is time-resolved: where metering exists, emissions are calculated at high temporal granularity and can vary by hour, day and season as demand, supply mix and operating conditions change. The hourly profiles presented in the Results show that relying on annual averages would mask substantial variation in emissions intensity. This matters because spa operations are characterised by strong seasonality and pronounced weekly patterns in occupancy and demand, and because decarbonisation interventions (e.g., operational changes, demand management, renewable utilisation) often target specific periods rather than annual totals.
Second, SPA-DEC is dynamic in its allocation logic. Per-visitor footprints are not derived from a single annual ratio, but from a structured attribution of emissions to visitor stays, recognising that spas accrue emissions both during opening hours (when services are being delivered) and during closed hours (when baseline requirements persist). This distinction is central in large facilities with substantial thermal demand and continuous support systems. By separating open-hour emissions (allocated per visitor-hour) from closed-hour overhead emissions (allocated per visitor), SPA-DEC avoids a known failure mode of naive hourly allocation, where very low occupancy periods can produce implausibly high per-visitor intensities and closed periods can either be ignored or implicitly misattributed. The approach therefore improves both interpretability and fairness: each visitor’s footprint reflects the operational conditions that prevailed during their stay and a transparent share of the facility overhead that enables the service to exist.
The value of the per-visitor dimension lies in three areas. First, it produces a functional unit, kg CO2e per visit, that is comparable across facilities, time periods, and ticket types, enabling benchmarking that aggregate totals cannot support. Second, it enables visitor-facing communication and, where required by emerging carbon offsetting mechanisms, visitor-level attribution at the point of exit. Third, it connects the intensity of a visit to the conditions under which it occurred, which is actionable information for both facility operators and informed visitors.
A further implication of this dynamic allocation is that it provides a direct bridge between facility operations and visitor-facing indicators. In many organisations, GHG accounting remains an annual compliance exercise disconnected from operational decision-making and visitor communication. SPA-DEC is designed to connect these domains: it preserves the integrity of whole-facility totals while producing per-visit metrics that can support internal benchmarking, scenario testing, and consumer communication.
Alignment with standards
SPA-DEC is intended to be compatible with widely used carbon accounting and LCA standards without replicating them in full. At the organisational level, the scope structure follows the GHG Protocol’s Scope 1–3 framework and aligns with ISO 14064 principles for inventory and emissions reporting. This matters for spa operators because electricity and gas are typically straightforward to report, but a substantial share of emissions may lie in value-chain categories (e.g., goods and services, logistics, fugitive emissions management, staff travel), and reporting requirements and stakeholder expectations are increasingly moving beyond Scopes 1 and 2. SPA-DEC provides a practical structure to incorporate these sources while maintaining traceability of how each category contributes to facility totals and per-visit outputs.
At the method level, SPA-DEC is informed by life cycle thinking (ISO 14040/44) in the treatment of indirect emissions and emission factors. However, SPA-DEC is not presented as a full multi-impact LCA of spa services. Its primary objective is to quantify the climate-change footprint of visits using greenhouse gas emissions expressed as kg CO2e, and the results reported here focus on GWP100: the most common characterisation metric used in organisational GHG emissions. This enables comparability with prevailing reporting practice and with policy and corporate targets framed in CO2e. A wider LCA can be valuable for spa facilities but extending to multi-impact assessment requires additional impacts, modelling choices and uncertainty treatment that are beyond the scope of a footprinting tool intended for broad operational uptake. SPA-DEC therefore occupies a complementary position, providing a transparent, scope-consistent climate indicator that can be implemented with existing operational data.
SPA-DEC strengths
SPA-DEC’s main contribution is a sector-specific, implementable method to convert whole-facility activity data into time-resolved, per-visit footprints, while retaining a transparent connection to scope-based reporting. This is important in a sector where the evidence base remains sparse and inconsistent, and where existing eco-labels and certification schemes do not consistently provide quantified, comparable carbon metrics. By explicitly mapping data sources to scopes and emission categories and by reporting outputs in a clear per-visitor functional unit, SPA-DEC supports benchmarking over time and comparison across facilities, as well as clearer internal decision support.
SPA-DEC balances comprehensiveness and usability. The approach can incorporate detailed metered flows when available, but it can also remain functional when certain categories are only available as annual totals or spend-based records. In the Large Wellness Facility case study, this is particularly relevant for “additional goods and services”, which captures procurement and services where physical quantities are not recorded in the required units. Recognising these categories is preferable to omitting them, as omission would bias results towards metered utilities and understate the role of procurement, maintenance and services in the overall footprint. At the same time, the explicit identification of spend-based components makes data-quality priorities visible: facilities can see where upgrading from spend proxies to quantity-based emissions would most reduce uncertainty and improve comparability. SPA-DEC is inherently modular, allowing facilities to include or omit emission categories based on their data availability and reporting requirements. This ensures the tool is tolerant to all data maturities.
The granularity of the outputs enables analysis that is difficult to obtain from conventional annual emissions. Hourly profiles support identification of emission-intensive time windows and can be used to evaluate operational interventions (e.g., reducing peak grid reliance, managing back-up heat demand, optimising renewable utilisation). The counterfactual renewable analysis demonstrates how the same framework can quantify avoided emissions from specific supply configurations while remaining grounded in metered activity data. When linked to carbon offsetting mechanisms, this level of detail is required38.
The two-facility inclusion demonstrates that SPA-DEC is transferable beyond large-format thermal spas. The core allocation logic applies equally to the simpler operational profile of the Small Wellness Facility. This suggests applicability to a broader class of visitor-economy service facilities, including leisure centres and aquatic facilities, and potentially to other service-based infrastructure where operational emissions must be attributed to individual users. Full adaptation to other contexts would require sector-specific inventory development, but the methodological framework does not present barriers to extension.
Limitations and boundary considerations
Several limitations should be considered when interpreting the results and the broader applicability of SPA-DEC.
Temporal scope
Both case studies draw on a single calendar year of operational data (2024). While the within-year temporal resolution is high, multi-year profiles would strengthen conclusions regarding seasonal patterns, longer-term decarbonisation trajectories, and the stability of non-metered category estimates. For the Large Wellness Facility, 2024 represents the first full year of operation including photovoltaic commissioning, which makes it the most appropriate available baseline but limits comparison with prior configurations. Extending the analysis to multiple years is a clear priority for future work.
Data completeness and quality
While SPA-DEC is designed to remain usable under heterogeneous data maturity, incomplete sub-metering and limited inventory detail can introduce uncertainty, particularly for Scope 3. Spend-based categories (notably additional goods and services) are sensitive to the choice and granularity of emission factors and to accounting classifications. These limitations are not unique to SPA-DEC; they reflect structural constraints in organisational data systems. The Monte Carlo analysis quantifies their contribution to output uncertainty and provides a direct guide to where data improvement efforts would be most productive. Nonetheless, they should be treated explicitly in reporting, and future work should prioritise improving procurement and maintenance inventories, as these categories can be material and are often poorly characterised.
Allocation assumptions and representativeness
SPA-DEC allocates shared facility emissions to visitors based on transparent rules that separate open-hour operational loads from closed-hour overheads. This improves interpretability and avoids pathological per-visitor estimates during low occupancy, but it does not fully resolve the inherent challenge that visitors do not consume resources uniformly. The results presented here assume homogeneous visitor behaviour within the defined visit duration. In practice, usage varies across features (e.g., sauna use versus lounging), and these differences may matter when the objective is personalised footprinting. Where access-control or feature-occupancy data exist, SPA-DEC could be extended to allocate portions of energy and water to activity classes or zones.
Multi-impact assessment
As noted above, the current framework reports GHG emissions only. For water-intensive facilities in particular, the absence of water use, eutrophication, and particulate matter results represents a meaningful gap in the environmental profile. Future work should develop the inventory base required to support multi-impact characterisation alongside the GHG results. A related avenue for future work is the explicit analysis of the energy-water-waste nexus at the visitor level. Examining how carbon KPIs correlate with peak water demand and seasonal waste generation could enable a more integrated reporting framework that recognises the interdependence of these operational flows rather than treating carbon as a standalone variable.
Implementation
SPA-DEC is designed to be implementable within day-to-day spa operations and to generate outputs that are meaningful to both facility managers and visitors. At the Large Wellness Facility, the most direct deployment pathway is a near-real-time footprint issued to visitors at the point of exit. Because the method draws on high-frequency metered consumption data and uses a time-based allocation approach, the footprint associated with a given stay can be calculated once a visitor’s entry and exit times are known and the corresponding operational emissions profile is available. In practice, this enables a receipt-style output (digital or printed) that reports the estimated kg CO2e attributable to the visit, together with a breakdown by major sources or scopes. Importantly, the footprint is dynamic: it reflects not only the duration of the stay, but also the conditions under which the visit occurred. For example, seasonal demand, the degree of reliance on grid electricity and gas back-up, and baseline overheads that must be allocated across visitors.
An alternative implementation is to estimate footprints in advance of a visit. This is feasible where the expected length of stay or ticket duration is known or can be predicted using historical patterns. In such cases, SPA-DEC can provide indicative footprints at the point of booking or entry, enabling visitors to make informed choices and allowing facilities to communicate the likely emissions implications of different ticket types or time windows. For example, facilities may choose to present a range for a given ticket duration, updated periodically as operational conditions and energy supply mixes change. While pre-visit estimates necessarily rely on forecasted rather than realised conditions, the same framework can be used to update the estimate post-visit using actual entry/exit times and realised metered consumption, ensuring consistency between prospective and retrospective reporting.
Beyond visitor-level communication, SPA-DEC’s scenario modelling capability positions the framework as a strategic planning tool for facility managers. By substituting alternative energy configurations into the same metered consumption framework, managers can evaluate the emissions implications of prospective operational changes before they are implemented. This includes assessing the impact of phased renewable integration, fuel switching, demand management interventions, or changes to operating hours. Rather than functioning solely as a retrospective reporting tool, SPA-DEC can therefore support proactive decarbonisation planning by quantifying the emissions benefit of specific transition pathways under realistic operational conditions.
Alongside this article, this research will provide access to an interactive results dashboard that allows users to explore the outputs generated by SPA-DEC and to examine the implications of the method for benchmarking and decarbonisation.