Bears tighten grip on AVAX as open interest rises alongside falling prices
Avalanche [AVAX] token prices were down by 4.91% in the past 24 hours. This was among the biggest price drops for crypto assets in the top 35, by market capitalization, CoinMarketCap data showed.
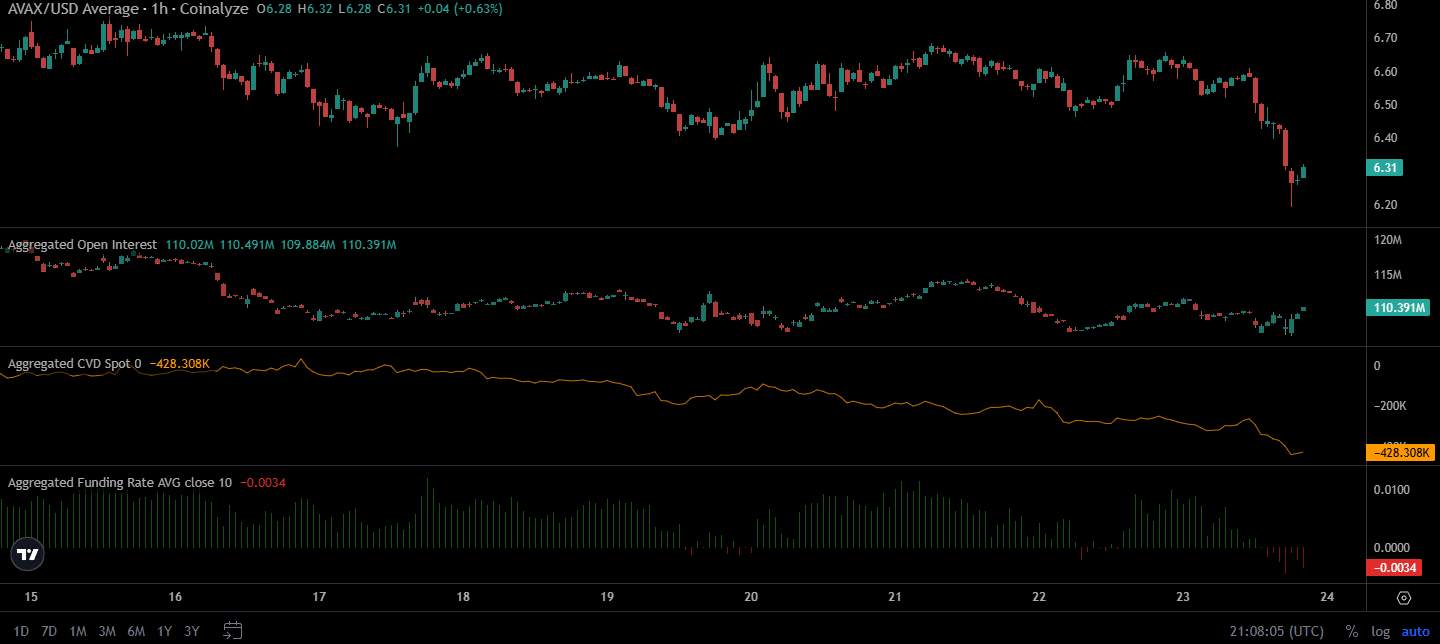
The price drop came alongside an uptick in Open Interest in the past few hours, even as prices fell below the $6.50 local support zone. The spot CVD declined noticeably, and the funding rates also slipped into negative territory.
In other words, the short-term market expectations were firmly bearish. Let’s see what the price trends hold in store for AVAX bulls.
The Avalanche bulls’ struggles have centered around $7 recently
In a recent report, AMBCrypto detailed how the altcoin’s price trends were stalling even after a 20x surge in daily transactions onchain. The long-term price trend of Avalanche was pointed downward.
It did not help that in the past 24 hours Bitcoin [BTC] fell below the $65.5k local support zone and was trading below $65k too at the time of writing. If this selling persists, it could trigger a bearish market sentiment shift, dragging AVAX further south.
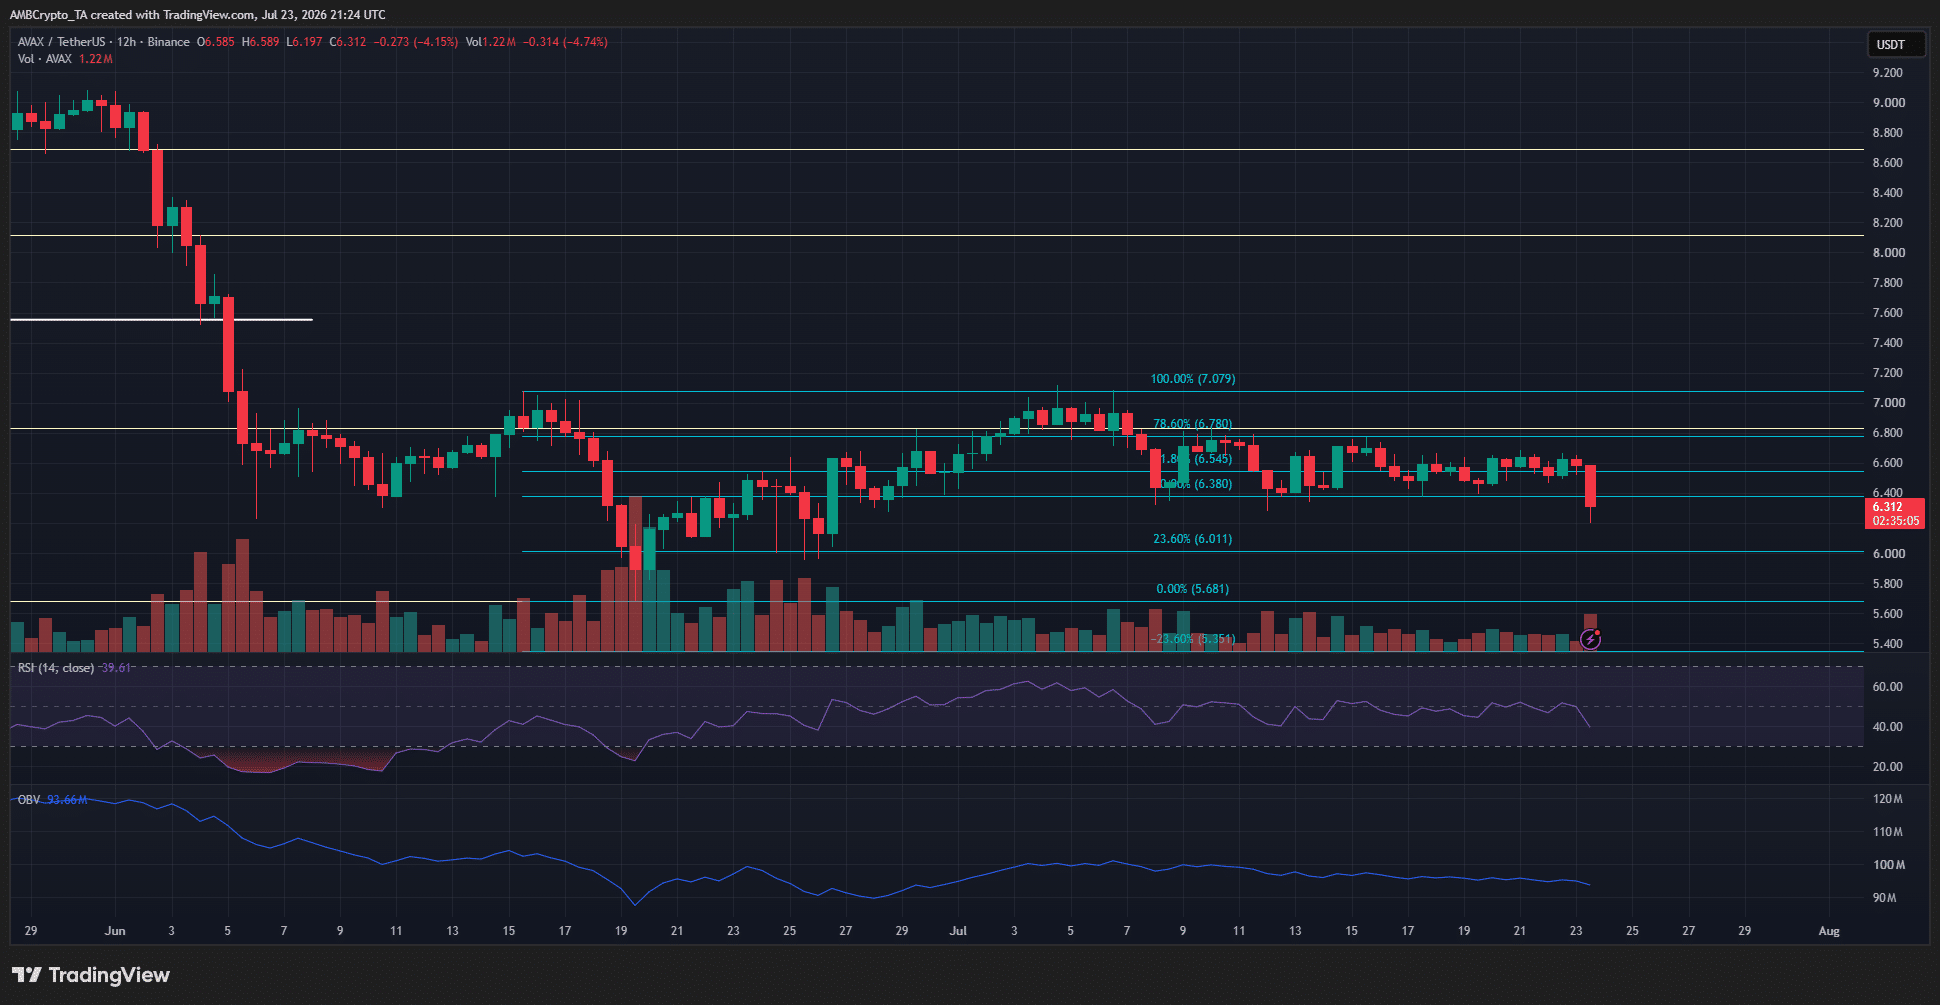
The longer-term downtrend saw a new swing low registered at $5.68. On the 12-hour timeframe price chart above, this has given rise to a bearish swing structure. A bullish structure would have come into play had the $7.08 swing high been broken.
It was tested in early July, but not broken. The subsequent rejection has dragged prices lower. Over the past two weeks, AVAX has traded between $6.38 and $6.78.
At press time, the band of support around $6.40 appeared to have been breached. This could accelerate the downtrend and drive prices toward $6 and below in the coming days.
Traders’ call to action- Maintain a bearish bias
As the Coinalyze data showed, short-selling was becoming popular. As bearish conviction takes root in the derivatives market, it could lead to a short squeeze.
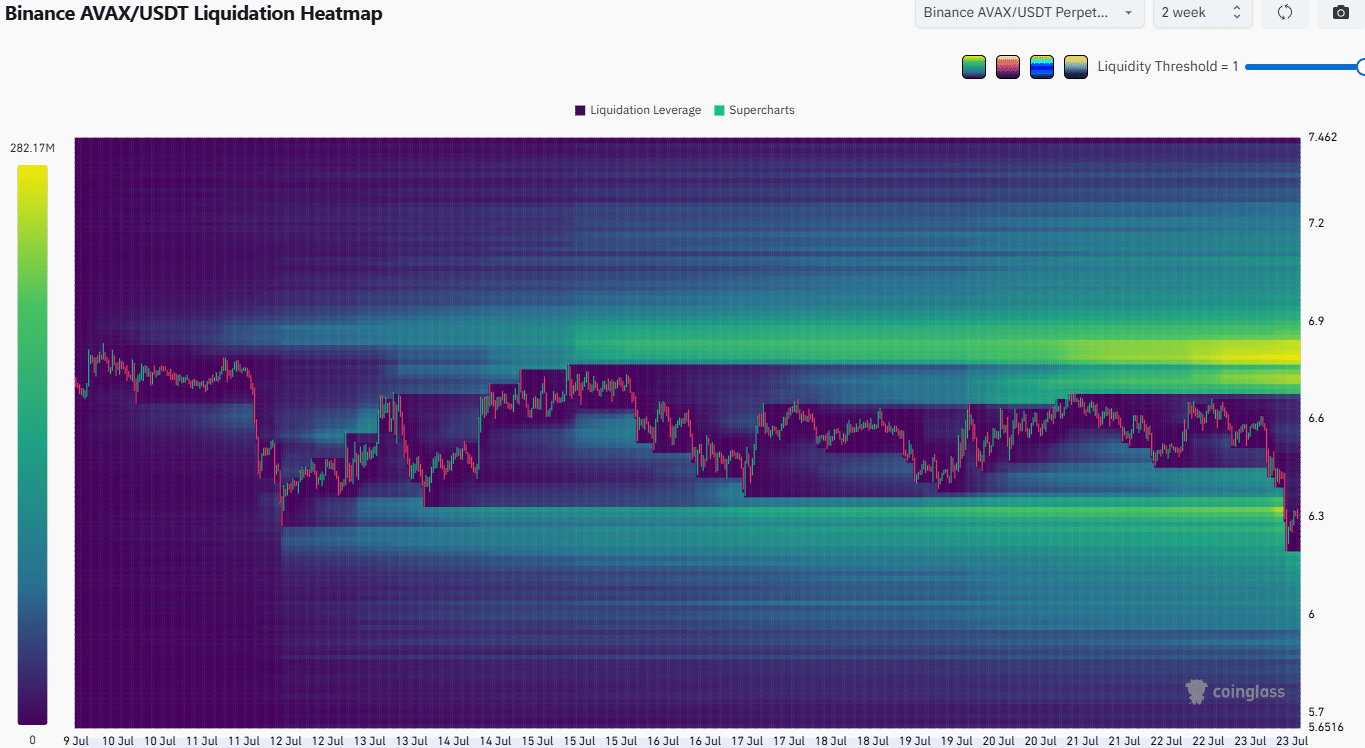
The 2-week AVAX liquidation map underlined this threat precisely. To the north, the $6.70-$6.85 area had a dense cluster of short liquidations. This area can be a key magnetic zone that pulls prices upward briefly, before a continuation of the existing bearish trend.
Therefore, traders can maintain a bearish bias but also be wary of a short squeeze.
Final Summary
- Avalanche witnessed steady spot selling, a slight uptick in Open Interest, and negative funding rates in recent trading hours- pointing to heightened short-selling.
- The loss of the $6.50 support zone could push prices toward and below $6.0 next, but traders should beware of a potential short squeeze.