Please help me understand figure on subspace similarity in LoRA paper. [D]
![Please help me understand figure on subspace similarity in LoRA paper. [D]](https://preview.redd.it/3l5qhbiroech1.png?width=640&crop=smart&auto=webp&s=e5534631f23bcc8d8e89b7fd411120c2b7a84442 "Please help me understand figure on subspace similarity in LoRA paper. [D]") |
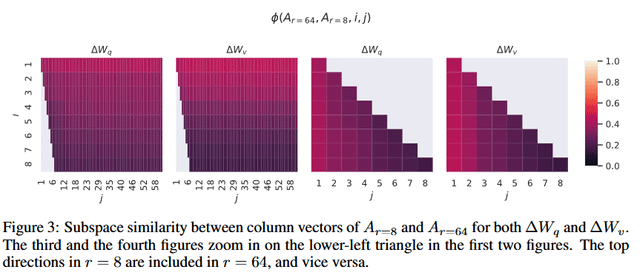
I am studying the LoRA paper and have trouble understanding this figure. The function essentially measures how much of the subspace spanned by the top i vectors is contained in the subspace spanned by the top j vectors in the higher rank matrix. Therefore, j can not be lower than i. So when they say the 3rd and 4th figure zoom in on the lower-left triangle of the 2 left-most figures, how are there values for j=1 and i equals 2 to 8? I dont understand what kind of y-axis the 2 right figures are supposed to be using. Thanks in advance! submitted by /u/BelzebubReincarnated |